Here’s How Spill Over for Green Card via EB1, EB2, EB3, EB4 and EB5 Works
Have you wondered why the dates for EB2 India and EB3 India for Green Card are not moving and number of Green Card issued for EB2 India came from 23,000 to 3,000 in 3 years?
U.S. Immigration law allows foreign nationals to obtain Green Card (aka Permenant Residency in the USA) through Employment. There are three different Categories within Employment Based Green Card – EB1, EB2, EB3.
What about EB4 and EB5?
EB4 is for Religious Workers and EB5 is for Immigration through Investment (1 Million Dollars or $500,000 in certain areas).
There’s a set limit on how many Green Cards can be issued per year per country per preference category through Employment Based.
By the end of this article, you will have a clear understanding of how EB Spillover Rules work.
- Green Cards Quota Per Year via Employment = 140,000
If you are new to Green Card Process and don’t have a good understanding about the steps involved, read this U.S. Permanent Residency Green Card Process and Steps.
Here’s Annual Limits for Employment Based Green Card for FY 2018 from the Dept of State.
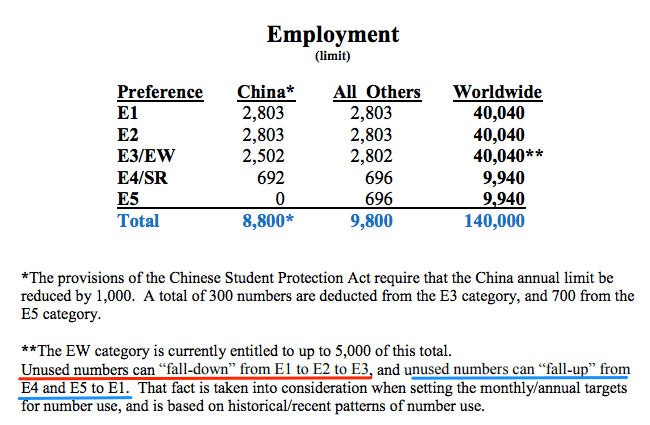
Each Country has a Cap of 7% Per category
- EB1, EB2 and EB3 = 7% of 40,040 = 2,803
- EB4 and EB5 = 7% of 9,940 = 696
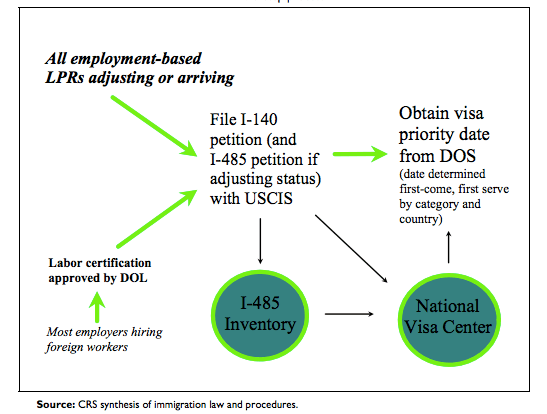
If you look at I-485 Inventory data, there are four countries (India, China, Mexico and Philippines) that are typically impacted by backlogs (more applicants than available Green Cards Cap per country). Since, there’s not enough applicants from other counties, we have another Category of Country – Rest of the World (ROW).
When there’s unused Green Cards from other Categories, they began to move Up, Down and Sideways as underlined in the above picture – “Fall-Up” and “Fall-Down” and let me add one more term “Fall-Side“.

Now you have an idea about how Employment Based (EB) Green Card Category Spill Over Works. Let’s apply this theory with Real Data for FY 2017 Green Allocations by Country and Category.
- Every few months, USCIS publishes I-485 Inventory Data
- Every month Department of State publishes Visa Bulletin
With this knowledge about Spill Over, I-485 Inventory Data and Visa Bulletin, we have to answer the following questions:
- How to estimate the Priority Date movement from coming months?
- How to estimate the Green Card Wait Times using I485 Inventory Data?
- Why EB2 India, EB3 India is moving slower and EB3 China is moving fast?
Before we can answer the above questions, you have to understand the Role of USCIS and the Department of State. You may have noticed the following from two data sets.
- I-485 is filed with USCIS (Falls under Department of Homeland Security)
- Visa Bulletin is announced by the Department of State
As per immigration law, the number of available visa quota is controlled by the Department of State. They would release the number of Visa to USCIS, who would then Adjust the Status of Applicants to Permanent Residency.
The Department of State can technically give all the available EB Visa on the First Day of Fiscal Year (Oct 1) or Release the visa numbers as requested by USCIS every month or every quarter.
The Department of State doesn’t know, how many Visa numbers would be requested by USCIS.
USCIS doesn’t know how many visas would be released by DOS.
To better control the demand, DOS introduced Final action Dates and Filing Dates for I-485 to figure out the Visa Demand. So, USCIS would know in advance how many applicants would file for I-485.
Due to years of wait, not everyone with approved I-140 would file for I-485.
If you don’t understand the logic at work here, don’t worry. Move on to the next stage to understand How the Spill Over for Employment Based Green Card works.
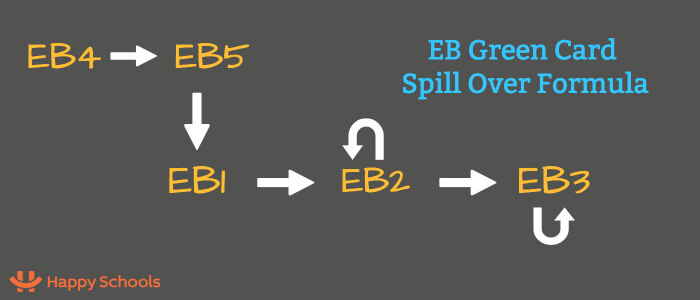
EB Green Card Spill Over
- Unused EB4 would spill over to EB1
- Unused EB5 would spill over to EB1
- Unused EB1 would spill over to EB2
- Unused EB2 would spill over to EB3
Let’s look at each category with available Cap per year.
Fall Up – EB4 and EB5 to EB1
As you look at the numbers below, here’s how I’m getting the Numbers:
- Total Available = Based on Table 1 Above (As per US Immigration Law)
- Total Issued = Based on Annual Report published by Department of State
- Spill Over and Left Over = Manual Math based above two reports
EB4 FY 2017 Numbers:
- Total Available EB4 = 9,940 (as per Law)
- Total Issued for EB4 = 8,997
- Left Over EB4 = 9,940 – 8,997 = 943 (This Spills Over to EB1)
So, EB4 had a maximum of 9,940 for FY 2017. But, only 8,997 was issued. S0, unused 943 visas from EB4 would spill over to EB1.
EB5 FY 2017 Numbers
- Total Available EB5 = 9,940
- Total Issued for EB5 = 10,090
- Left Over from EB5 = 0
EB1 FY 2017 Number
- Total Available EB1 = 40,040
- Total Available with Spill Over from EB5 = 40,040 + 943 = 40,983
- Total Issued for EB1 = 41,827
Don’t ask me why 41,827 Visas were issued for EB1. That’s what reported in the Department of State’s Immigration Visa Report.
- Quiz: What does this mean for EB2? How many visas is available in total for EB2 for FY 2017?
EB2 FY 2017 Numbers
How many visas came from EB1 to EB2? The answer is ZERO!
Now, you should be getting an idea about why EB2 Numbers are not moving to India!
- Total Available EB2 = 40,040
- Total Available with Spill Over from EB1 = 40,040 + 0 = 40,040
- Total Issued for EB2 = 39,961
- Unused EB2 = 40,040 – 39,961 = 79
Quiz: When there’s a backlog in EB2 for India and China, why did 79 go unused? Well, I don’t know the answer, but, I think, is because the Visa Demand and the numbers given by Department of State.
It’s time to introduce one more Statistics here for EB2 India.
- Total EB2 Visa Issued for India for FY 2017 = 2,879
Now, you must be wondering!
What? Out of 40,040 available for EB2, why did India get just 2,879.
Before looking at deeper data within EB2, let me finish the math for EB3 for FY 2017. Then we can take a deeper dive within EB2 and EB3 and how “Fall-Side” works within Each Employment Based Preference Category.

Can you guess the answers?
Why don’t you ask the same questions with your friends?
Check what do they have to say. Majority of Non-Immigrants know about never ending Green Card wait times. Numbers of years vary (from 10 to 70 years).
You can even search around on Google to find How EB Spill Over works. There’s no detailed analysis like this one.
Now, you have read the Spill over math for EB2, it should be pretty easy to guess for EB3. If you haven’t guessed the answers, here’s the questions again.
- How many Visa did EB3 India get from EB2 Spill Over?
- Can you guess how many EB3 Visa was issued in India for FY 2017?
For the first question, you should know the answer based on my explanation so far in this page. If not, you must read it again for EB4 to EB5 to EB1 to EB2.
For the second question, you should be following the Report from Department of State. But, it’s easy to guess based on the EB2 numbers (to some extent).
The Answers:
- EB2 to EB3 spill over for India = 0
- Total Issued to EB3 India = 6,608 (FY 2017)
EB3 FY 2017 Numbers:
- Total Available EB3 = 40,040
- Total Available with Spill Over from EB2 = 40,040 + 0 = 40,040
- Total Issued for EB3 India = 6,608
- Total Issued for EB3 China = 2,348
- Total Issued for EB3 South Korea = 3,290
- Total Issued for EB3 Philippines = 6,492
- Total Issued for EB3 Overall = 34,938
Again, I don’t know only 34,938 was issued when available, numbers is 40,040 for FY 2017.
How did EB3 India get 6,608, when EB2 India got just 2,879 for FY 2017?
Simple Math at work here: Spilover from Rest of the World (ROW).
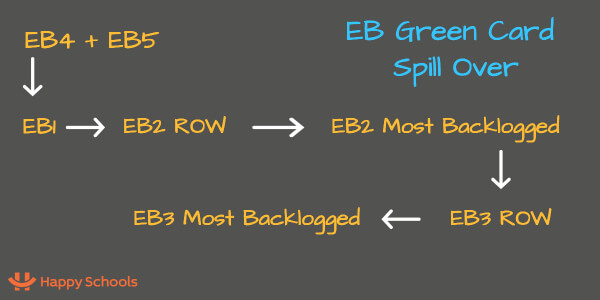
EB2, EB3 Spill Over: Deep Dive
- EB4 unused => EB1
- EB5 unused => EB1
- EB1 unused => EB1 Most Retrogressed countries => EB2 ROW
- EB2 ROW unused => EB2 Most retrogressed countries => EB3 worldwide
- EB3 ROW unused => EB3 retrogressed countries
So, how does this math within EB2 Work?
Total Available per country (lets take two countries)
- India – 2,803
- China – 2,803
Total Available for EB-2 for All Counties
- Total Available EB2 = 40,040
- Total Issued to India = 2,879 (as per report for FY 2017)
Let’s look at why EB2 India only 2,879.
Within EB2, allocated visas are split into the following buckets (as per I-485 Inventory Data):
- EB2 India
- EB2 China
- EB2 Mexico
- EB2 Philippines
- EB2 ROW (Rest of the World)
The most retrogressed country is India.
- Total Available for India in EB2 = 2,801
- Total Issued for EB2 India = 2,879
- Total Spill Over from EB2 ROW to EB2 India = 2,879 – 2,803 = 76
Yup. You read it right. Just 76 visa came from EB2 ROW.
Now, let’s look at the numbers for EB-2 India since 2018. Thanks to my friend who’s been keeping track of these EB-2 India numbers for these years.
- FY 2017 – 2,879
- FY 2016 – 3,930
- FY 2015 – 7,235
- FY 2014 – 23,527
- FY 2013 – 17,193
- FY 2012 – 19,726
- FY 2011 – 23,997
- FY 2010 – 19,961
- FY 2009 – 10,106
- FY 2008 – 14,806
As per this figure, the number of EB2 Visa issued for Indian Nationals came down drastically from FY 2014. Why did the numbers dry up?
There’s no spill over from EB1 to EB2 ROW and EB2 ROW to EB2 India.
Your next question should be based on the I-485 Inventory Data.
If 2879 Visa was issued, I should have received my Green card as per I485 Inventory Data. Why my priority dates are not moving?
EB3 to EB2 Porting
Another reason – There’s EB3 to EB2 porting.
Green Card applicants in EB3, would have gained enough experience and become eligible for EB2. Porting to EB2 would increase the wait times of EB2 applicants.
Ok. I hope I was able to articulate how to understand the Spill Over for Employment Based Green Cards.
Your next question – How do I calculate the Wait Times for my Green Card?
Above Math should have given you an estimate of how long it would take to get your Green Card if you apply for Green Card today.
If you want more insights, I have news for you. Check the following empty cells in the image below. I will analyze the data to get further insights.

EB Green Card Series of Articles
- How Long Does it Take to Get Green Card in the USA for Eb1, EB2, and EB3
- Green Card Steps for EB2 and EB3 Explained
- Green Card Visa Numbers availability for E1, EB2, and EB3
- US Green Card Waiting Time Based on Pending Applications
- Immigration Path: Steps for an F1 Visa to Become U.S. Citizenship
- How EB Green Card Spill Over between EB1, EB2, EB3, EB4 and EB5 works (this article)


Hi Raghu,
I heard that USCIS does spillover for each country individually first before moving them to backlogged countries. What this means is any unused ROW EB2 numbers are first spill over to ROW EB3 before they move to EB2 backlogged countries.
Can you comment on this? THanks
My Priority Date is Oct 2015. When do you think it will be current?
Both EB2 and EB3 India will take several years. Simple Math = 2800 visas per year per category. Divided by pending I-485 petitions will give a realistic estimates.
Around 2040.
My PD is Sep29, 2009 India in EB2, any chances of me getting Green this year
Congrats your date is current 🙂
I pity folks like you, you fall for the divide and rule policy of the per country cap, when you start thinking you’re better then someone else and then there will be someone better then you. Folks can say all EB2 folks graduated from fake universities that don’t require to attend classes, all students live like they live in a ghetto. It hurts don’t it, stop doing this, realize that we all are being taken advantage in this country, there is no race that is as successful as Indians but treated as shit in US, because folks like you who hate there own brethren , why will anyone respect Indians when we don’t ourselves. Get a grip and fight for equality not for preferential treatment, that is what anti immigrants are doing.
Thank you for detailed information. Now with the FB green card restrictions there is possibility of spillover to EB GC category, how this spillover works, will it all move to EB1?
Great article. My husband is on EB1 and our priority date is Feb 2018 and I am his dependent. When will the category become current according to your analysis?
May be somewhere around 2038-2040
It will be around the end of 2020.
Thanks Raghu for the analysis.. Just to double check that I understood this correctly, the Unused EB1’s from ROW will flow into the most retrogressed country for EB1. So for example, if India is most retrogressed, which it currently is and if there are any unused EB1s in the ROW, then India will get additional allocations to that extent. Correct? What has been the trend in the ROW EB1 quota consumption? Does it usually end up having unused visas? I have seen a trend where the wait for EB1 India goes upto 5-6years and suddenly becomes current within the same year. Why does that happen?
EB1 ROW has PD (Feb 2020 VB is DE 1, 2018), so there will be no spillover coming to EB1 India until that clears.
Thank you Raghu, please add your analysis based on 2018 Vs 2019 November data published by USCIS links below:
2018-Nov:
https://travel.state.gov/content/dam/visas/Statistics/Immigrant-Statistics/WaitingList/WaitingListItem_2018.pdf
2019-Nov:
https://travel.state.gov/content/dam/visas/Statistics/Immigrant-Statistics/WaitingList/WaitingListItem_2019.pdf
based on the above, how do we know the which year onwards how many are pending for country wise for each category?
many thanks.
I have a Green Card Guide, that includes the analysis (available for purchase).
Great article – do you have a sense of when the adjustment of filing date for EB1 would move from March 2017 (at the moment) to March 2019 for India ?
It’s been stuck in March 2017 for a while not and trying to estimate when I can file my adjustment of status (with a PD of March 2019)
Thanks!
Vs – EB1 will move if and when there’s spillover coming from EB4 and EB5. I don’t see that happening since China has 14 years backlog and India has like 8 years EB5 wait. So, EB1 will move at a slow pace (as per avail cap numbers).
Hi
What is prediction for eb1 i485 adjustment date for priority date of Aug, 2019?
Excellent Article Raghu. I have one question though. Do you think the high investor fee for ( EB5) will increase the spillover ?
EB5 is backlogged for many years. China’s wait-time is like 14 years and India is around 8 years. So, spillover will become effective after the current backlogs clear.
Hi,
Will HR-1044 (if it becomes a law) do any good for EB2 India? What I understand from HR-1044 is – all countries will be benefited from unused GCs in EB2 Category, but do we know how many GCs are left unused in EB2 category in 2018?
Thanks and Regards,
ronish
Hi,
Where can we find how many unused visa no’s are available for EB3 or EB2 india for 2020
Hi,
I have questions about the EB3 FY 2017 Numbers:
Total Available EB3 = 40,040
Total Available with Spill Over from EB2 = 40,040 + 0 = 40,040
Total Issued for EB3 India = 6,608
Total Issued for EB3 China = 2,348
Total Issued for EB3 South Korea = 3,290
Total Issued for EB3 Philippines = 6,492
Total Issued for EB3 Overall = 34,938
Why did China only get 2,348 while South Korea got 3,290 and Philippines got 6,492? How does the spillover from ROW work? China is more retrogressed than South Korea and Philippines.
Thanks in advance for your answer!
AFAIK USCIS does the vertical spillover first and for each country separately, before doing the horizontal spillover.
This articles needs to mention this USCIS practice.
South Korea uses fewer EB1 numbers. Hence it can use more EB2 numbers: 4909 in 2017, 4405 in 2018
The unused EB1 (out of 2803) for South Korea spilled over to EB2 for South Korea and then to EB3 for South Korea.
Philippines uses fewer EB1 and EB2 as well. Hence it can use much more EB3 numbers : 6492 in 2017, 6588 in 2018.
Hi Ash Prab,
Very good point.
How do you know that USCIS does spillover for each country individually first?
What is the source for this?
Thanks
Good Morning Raghu,
I have read your article multiple times and each time I have got a better understanding of the process. Per the following link, as of November 2018 there are only 876 EB1 pending applicants. https://travel.state.gov/content/dam/visas/Statistics/Immigrant-Statistics/WaitingList/WaitingListItem_2018.pdf
Given that each year around 2800 visas are allocated per country, can you advice if the applicants with PD earlier than November 2018 would become current for Indian applicants under EB1 category. Please advice.
You are correct about 2800 issued per year. But this data is only from NVC 🙂
Great article Raghu. I still didnt understand how EB3 allocation can be 6K and more than EB2 for India.
Also, my PD is Jan, 2010 under EB2. When do you think that will be become current ? If I port down to EB3, do you think EB3 Jan 2010 will be current anytime soon.
There’s Top to Down spillover – EB2 to EB3 (which is dried out).
There’s ROW EB3 to EB2 India spillover. That’s how you got the 6k.
I’m expecting both EB2 and EB3 will move in parallel going forward and EB3 will retrogress as I-485’s are filed due to Filing Dates being in advance.
EB3 India getting spill over from EB3 ROW (about 3,500) and get total more than 6K.
But EB2 India is not getting (or just 79) from EB2 ROW. and get total less than 3K.
Fabulous analysis Raghuram !!!
My PD is 08/15/2018 with EB1C – when can i expect it to be current ??
You show a good explanation of the spillover but you missed the elephant in the room buddy! MY GOD, WHY IS THIS SO HARD TO UNDERSTAND???
EB1-C India is being abused by Indian IT companies of CTS/TCS/WIPRO for the past 3+ years.
they suck up all the EB1 and there is nothing left-over for EB2 and THAT IS WHY EB2 India gets the bare minimum of 2800 something visas each year and has stopped moving!
Please check this blog and update yours so more people are educated —
http://eb1cmanagerfraud.blogspot.com/
EB3-to-EB2 porting is minimal now as most of the folks that were backlogged for years in EB3 have gotten their GCs.
Also, this EB1-C scam is IMPOSSIBLE not to notice if you are currently living in the United States.
You see so many, recently arrived cocky Indian families who are so completely disconnected from American culture. They are all EB1-C “geniuses” who use a loophole in the system and come in as “functional managers” whatever that might be. 😀
These folks are in their late-30s, have 1-2 kids 2-8 years old. Their clothes, dressing sense, food habits, TV shows they watch all are purely Indian. Their english tends to be horrible at best, as most of them never took GRE/TOEFL, they never studied in the US.
EDUCATING MORE EB2 Indians and USCIS folks, especially Mr. Oppenheirmer will ensure these quasi-legal Indians gets deported back to India promptly and the companies booked and fined!
I agree. Its disappointing to see that those gained experience and promoted to manager roles in US can only be ported from EB3 to EB2, but those gained similar experience outside US can directly apply for EB1.
I’m just trying to say that experience gained and manager titles should be given equal priority.
Besides, whats the point in paying all the social security taxes for a decade without any benefits ???
Hi, My PD is February 2018 EB1A India. All documents are cleared and I got the email from NVC that my file is in the que to be scheduled for interview. Can you please tell me when I can expect the interview. Thanks a lot for all your analysis.
Hello Ranjan,
It will be a while before you can expect the interview. Refer to the Green Card Guide for additional details on how to calculate the waiting time. http://geni.us/EBGreenCardProcess
Good details. My question is what happens to unused EB3 numbers? How do they fall? up? down? side?
There’s’ no unused EB3 numbers.
“Why these are empty” – Who is this question for. Are you going to answer that? Even I want to know why those are empty. Any clue?
It will take a while time to explain why the cells are empty 🙂
I did two Live Webinars on How to Navigate the Green Card Process (150 and 130 Minutes in Duration). You can watch the Q&A from June 2018 event and Full Session from Oct 2018.
Oct 2018 content is improved and answers readers questions from Session 1.
Here’s the link to the REcorded Version with Bonus Contents – http://geni.us/EBGreenCardProcess
Because this table is based on people who already has filed I-485, and the EB2 data has never moved beyond 2010 and so no one has filed I 485 after those dates… all are waiting…..
Excellent analysis. Thank you.
I have EB1A – PD March 2017 – India- what would timelines look for me? Thank you in advance.
My PD is 8/19/2016. When do you think this date might become current?
Based on Oct 2018 data, your Priority Date may become current around September 2021
How reliable is calculation?
As of
(YYYY-MM-DD): Pending I-485 Cases Ahead of You: Pending CP Cases Ahead of You: Your Overall Place in Line for Green Card:
2018-07-01 473 1658 2131
I removed the links. What category?
EB3.
I also wanted to know about the empty cells on your analysis above. Basically I am trying t figure out, how many people are in front of me
I’m hosting a Live Webinar on Oct 7 on this process. http://geni.us/GreenCardWebinar
You can learn how to decode the numbers and more.
The PD for my EB2 petition is March 9, 2016. Going by your analysis and applying the resources, I am guessing it will take approx. 15 – 18 yrs to get an EAD and another 2-3 yrs for the GC. What say?
Wouldn’t it be better to go back to India, gain experience there, change jobs even, and come back when the PD is nearing to be current? The whole revocation of I-140 is another animal to deal with though.
And you also have an option to go to Canada via Express Entry.
EB 2 India, PD March 2011. Planning to change job where they will have to start GC from scratch and that too in the last year of my H1 expiration which is 2020. Any suggestions on moving to new job or staying with current?
Appreciate your input.
I am on EB1 with priority date Jan 2018. What’s the estimated wait time?
why don’t you guys start work on changing the rule instead of asking when will I get my GC ?
no one will work for you if you don’t work for yourself.
Raghuram, very well explained and thanks for taking time to explain in detail
Hi ,
My EB2 Priority date is June 2011.When can I expect EAD (DATES FOR FILING OF EMPLOYMENT-BASED VISA APPLICATIONS) and Greencard (FINAL ACTION DATES FOR EMPLOYMENT-BASED PREFERENCE CASES).Appreciate your help and based on this I will look another job or move from USA.
As per Visa Bulletin May 2018 –> https://travel.state.gov/content/travel/en/legal/visa-law0/visa-bulletin/2018/visa-bulletin-for-may-2018.html
and June 2018 –>https://travel.state.gov/content/travel/en/legal/visa-law0/visa-bulletin/2018/visa-bulletin-for-june-2018.html
EB2 for India has moved 4 days in 2 months. So 2 days in a month average.
So do your maths.
For me my priority date is 2014 June.
Number of days between Dec 26 2008 and June 2014 is ~~ 2000 days.
So it will take 1000 months
1000/12 = 83 years approx.
So I can’t get it in my lifetime :).
Your estimate of time taken for an applicant ,whose priority date is Aug-2012, is 12 years to become current and get his GC. In gcreforms.org an applicant who applied in 2011, and hopefully got approved I140 in an year, is likely to get his GC after 33 years. Why is such a big difference
My priority date is Aug-2012 in EB2, my US born son age is 9. When will I get my green card?
Your son may turn 21 and sponsor you by the time EB2 moves to 2012!
My priority date eb2 2013 Jan, Can u please tell when it will be current??,Due to my high school going kid , I need to look for options appreciate your response.
Maybe 10 to 15 years at the current rate. 3000 cars issued per year. About 1400 new applications filed every month. Thinking EB5?
Great analysis . Change in laws must.Keep lobying
Awesome article. My PD is 2012 feb for eb3 category. When do you think my date will become current ?
Your kids would become eligible to sponsor your Green card before EB3 2012 becomes current. Change in law is required for faster movement.
I thought eb3 will move faster compared to eb2 for 2019. Can Aug 2011 eb3 become current in 2019?
Based on recent trends for past few months, I thought EB3 will move faster. any chance for aug 2011 EB3 to become current or atleast get EAD in a year or so?
excellent analysis. looking forward for more.